Went to the TRINUG Potluck and Lightning Talks Meetup last night. Lots of awesome presentations! I did a short lightning talk about some tips for Visual Studio. I covered 3 tips in 5 minutes, which is pretty quick. So, I wanted to discuss them again in long form here.
Ctrl+, VS 2013 and later
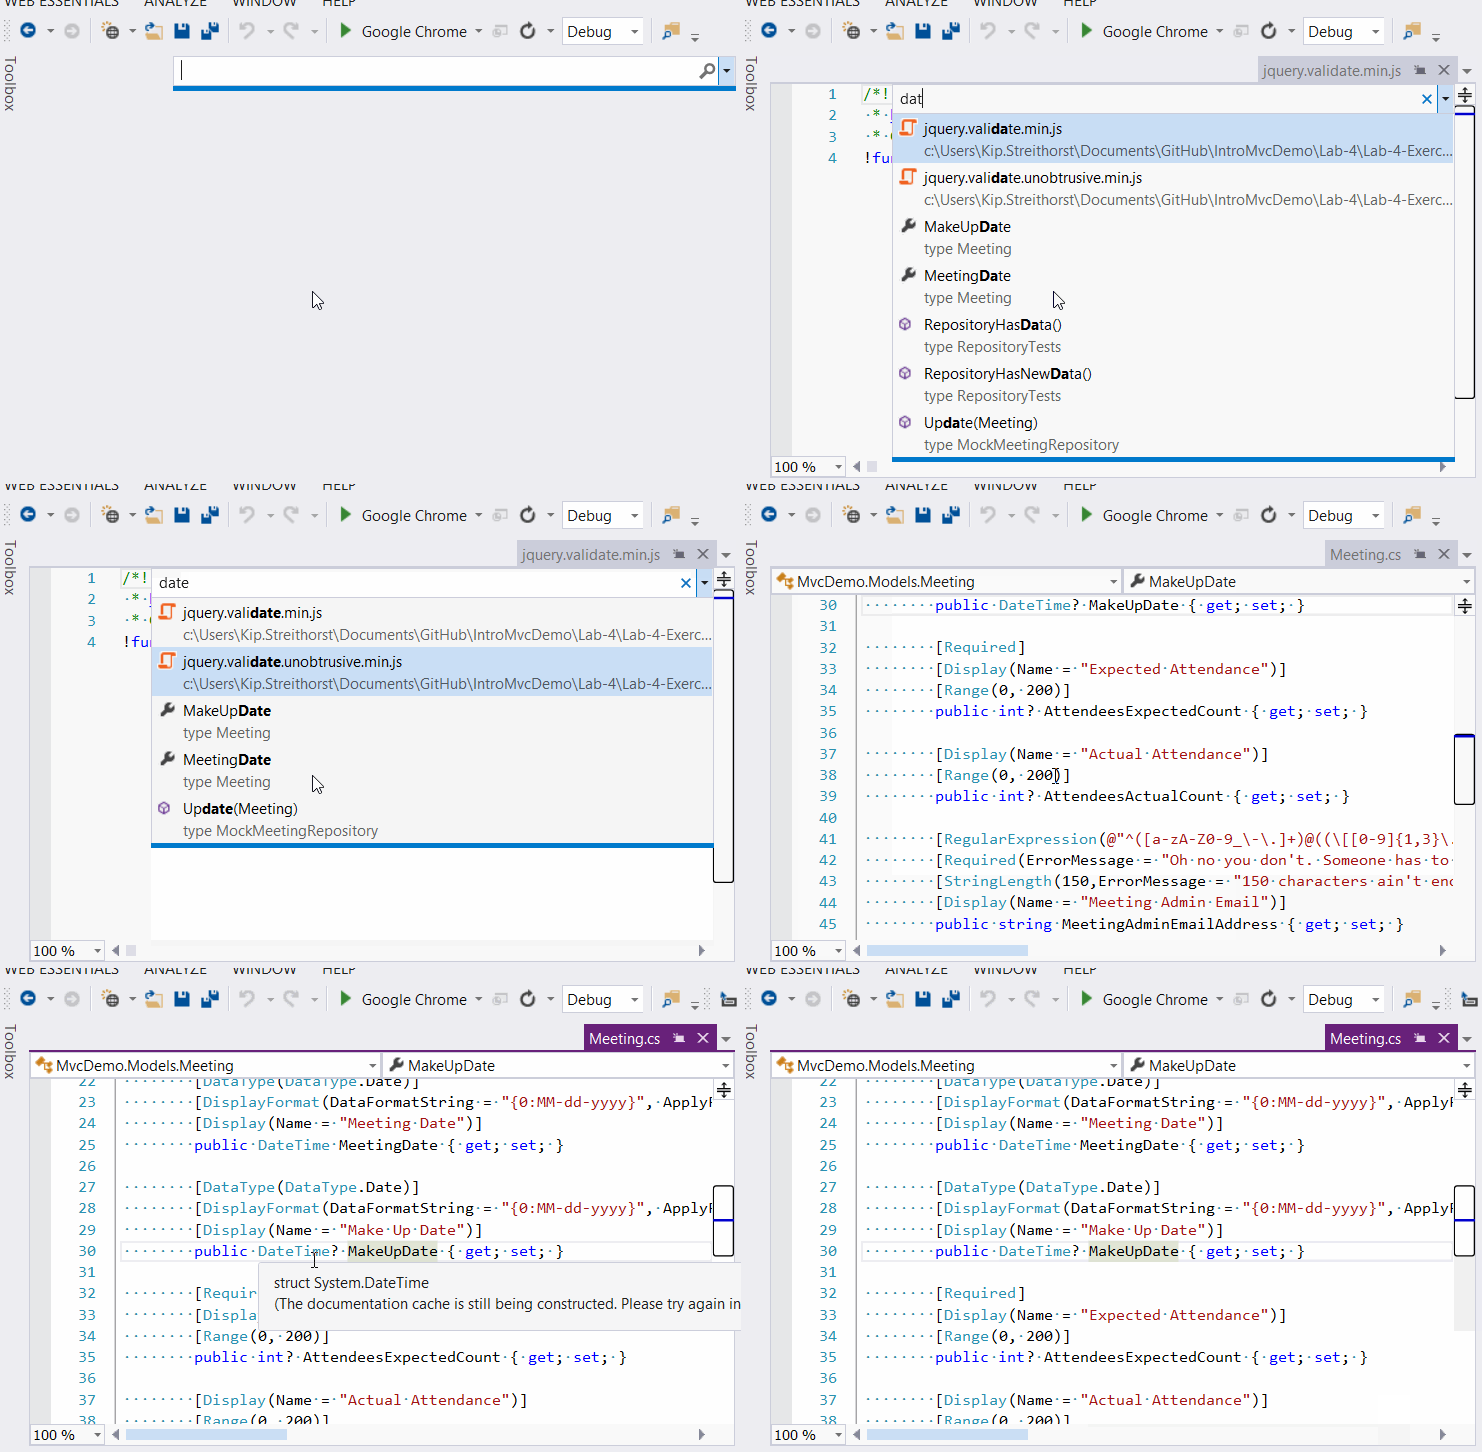
If you are using Visual Studio 2013 or later, you should be using the Ctrl+, keyboard shortcut. What it allows you to do is quickly open a file from the solution using just your keyboard. You don’t have to mouse over to Solution Explorer and inevitably forget what folder that file was in. And it’s very fast to use. I use it all the time and recommend you give it a try. I have a short video below showing me use it.

This shortcut works in earlier versions of Visual Studio, but is much more cumbersome to use. You can read about all of the nice improvements made in VS 2013, which is why I can now recommend using this shortcut. If you have Resharper installed you might notice a conflict since both use that key sequence, so you’ll have to be sure and pick the Visual Studio capability.
Tracepoints
Breakpoints are great, right? Until they aren’t. What I mean by that is they are great for inspecting the state of your application but it also means you have to hard stop your application and then resume once you’re done checking application state.
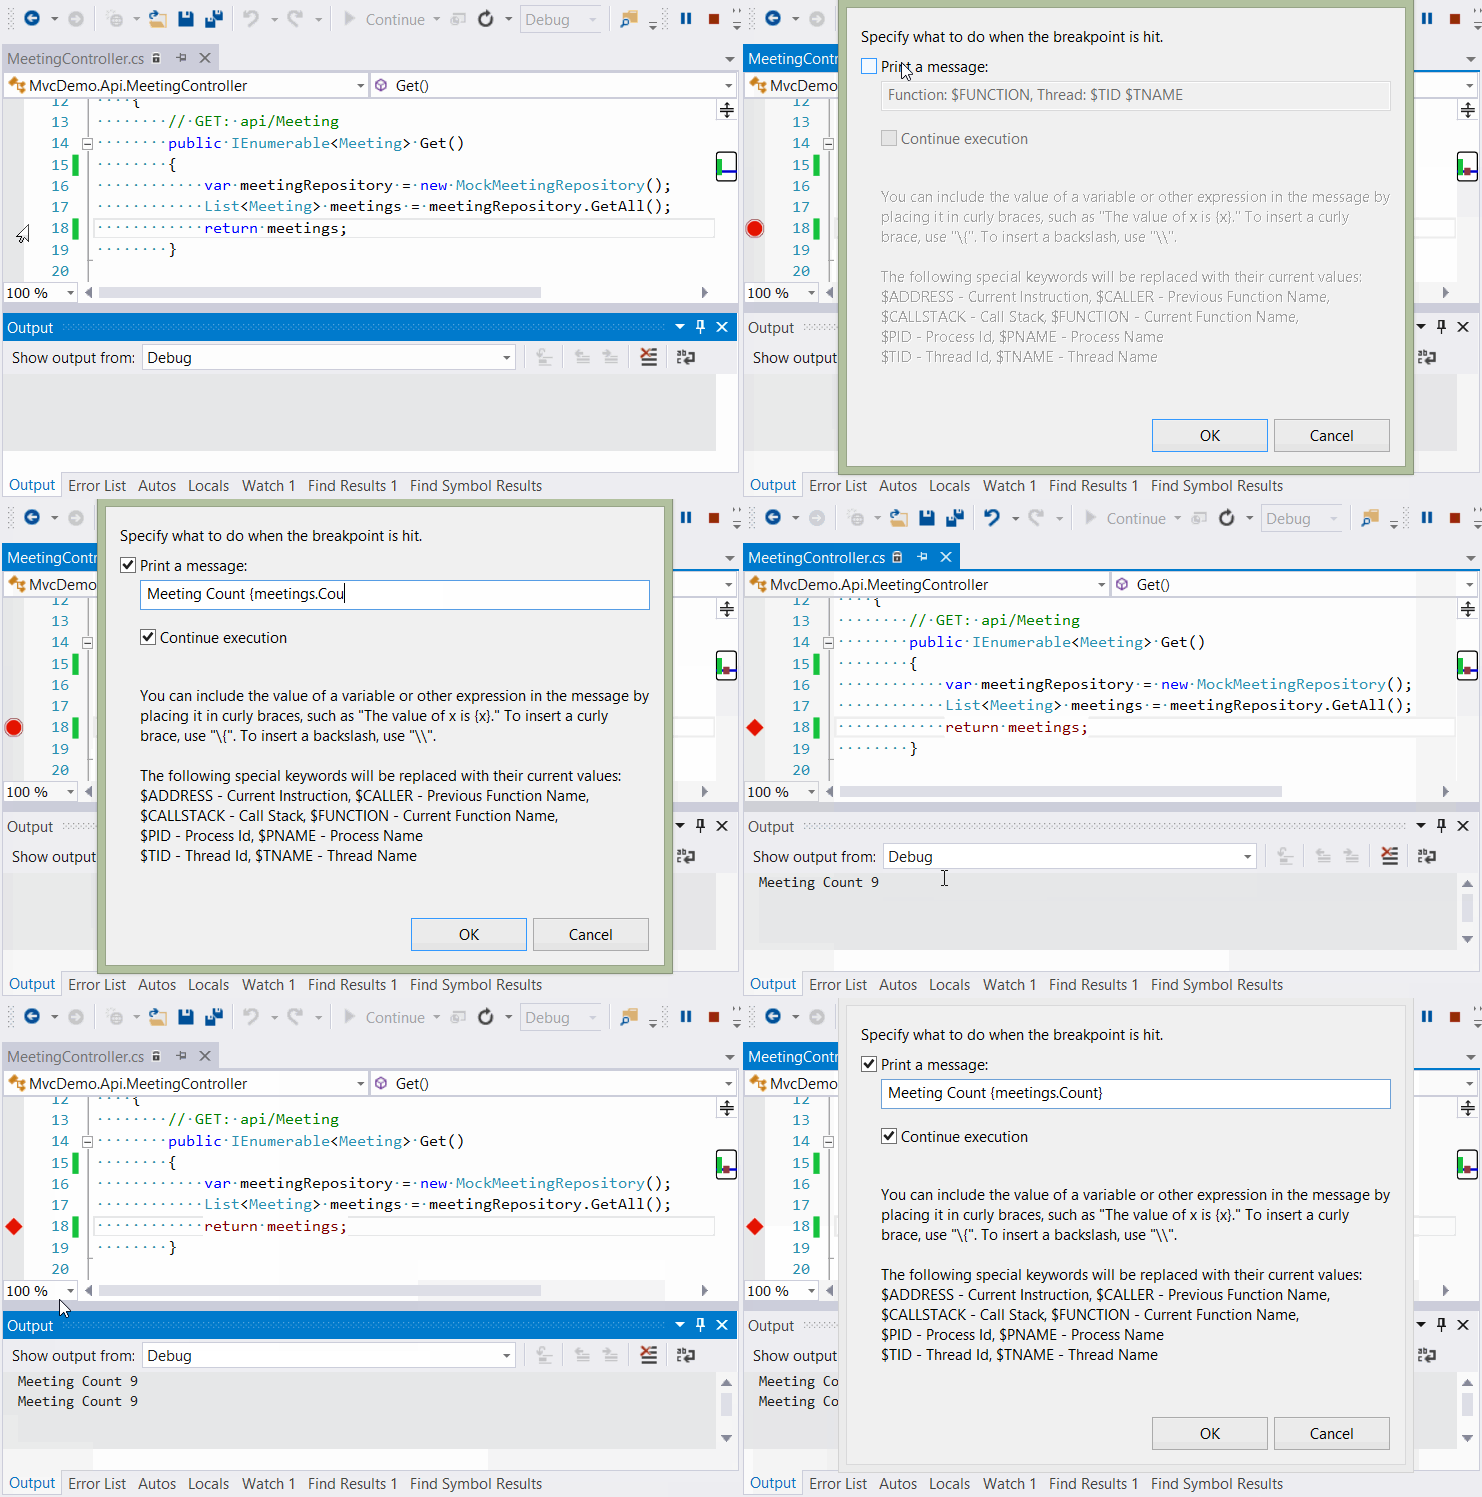
Well, in turns out you don’t have to hard stop the application, you can turn your breakpoint into a tracepoint. This allows you print a message to the Debug Output window (e.g. use the Output window and select “Debug” from the dropdown) and continue on without stopping the breakpoint. Tracepoints have been in Visual Studio since 2005 and are supported across a variety of languages and application types. I have a short video below demonstrating it.

More details on this feature on MSDN.
Finding caught exceptions
Ever suspect an exception is being thrown but you can’t seem to find it? For instance, you suspect a SqlException is being thrown and you also suspect another developer on your team put a catch clause somewhere and forgot to log the exception. We’ll since that other developer put that catch clause in there, good luck finding that exception. Or, maybe you can find it.
If you go the Debug Output window (e.g. use the Output window and select “Debug” from the dropdown) you can right-click and enable “Exception messages”. This will then print a message when an exception is thrown. This will help confirm your suspicions but other than that it isn’t very useful.
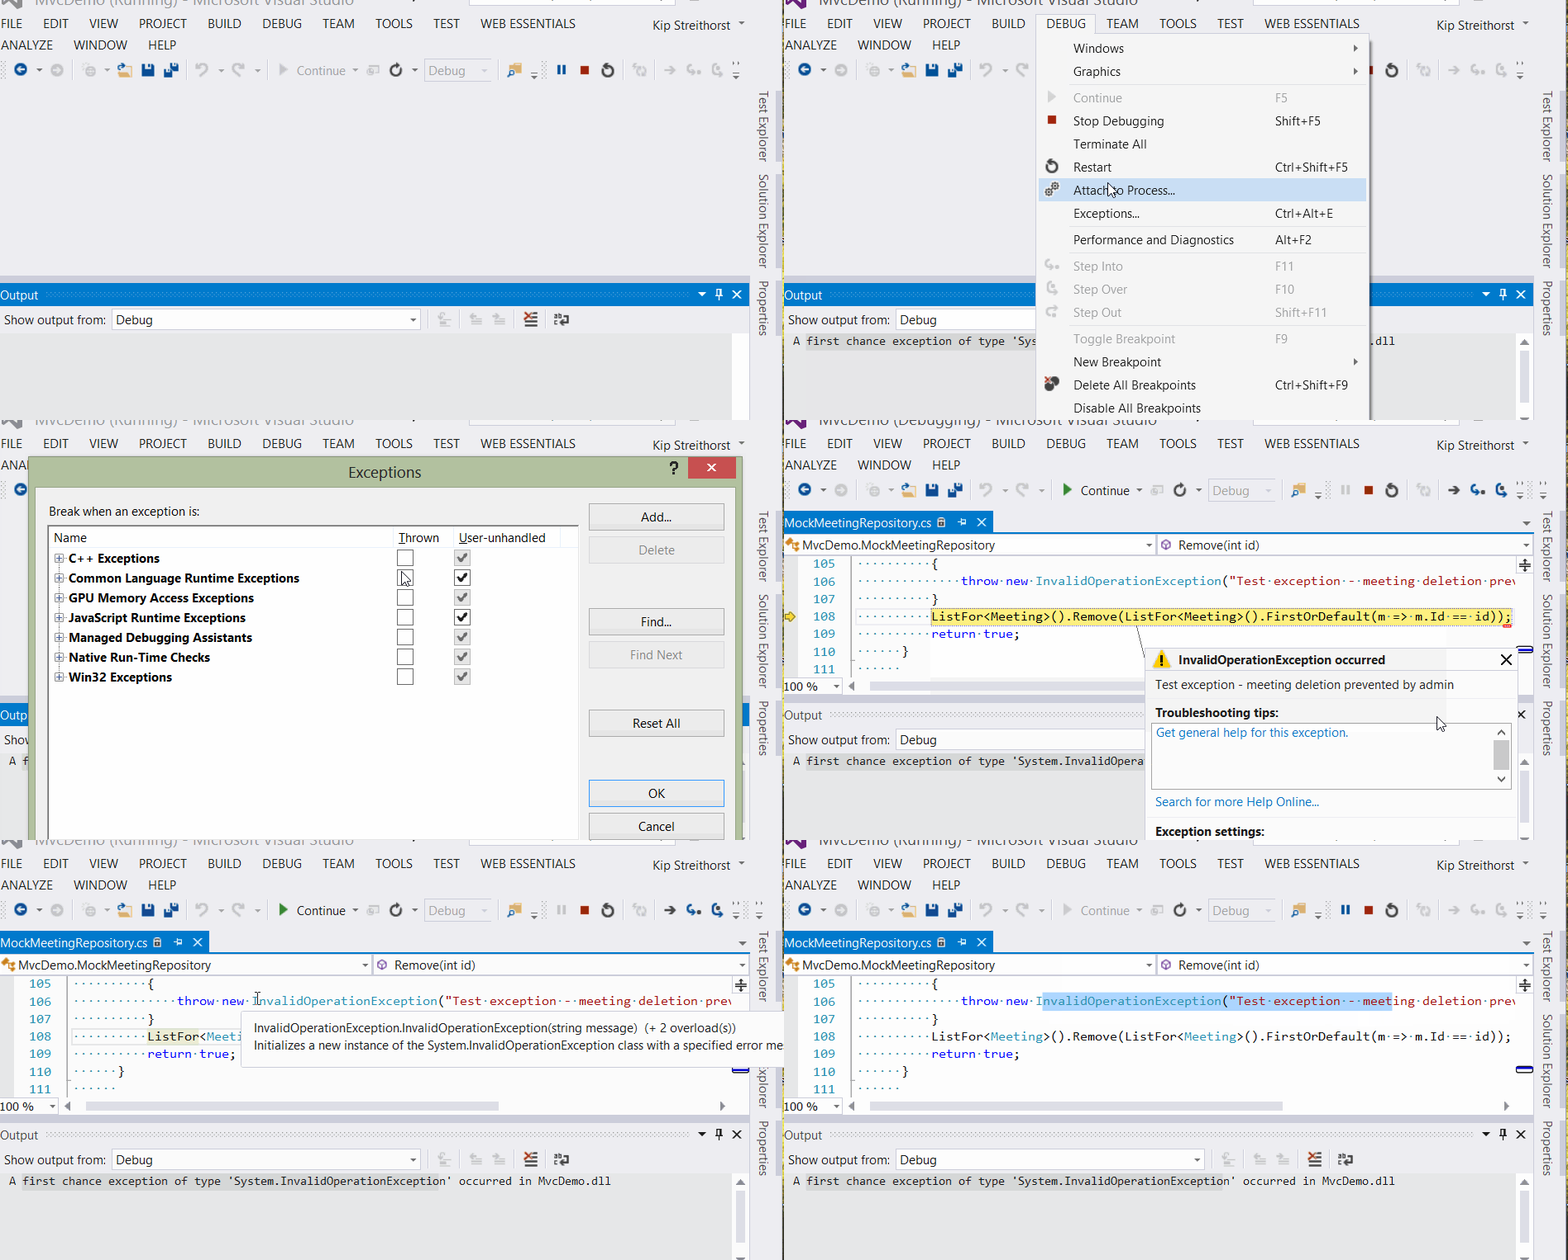
What is useful, is that you can go the Exceptions dialog (e.g. Debug\Exceptions… in the Visual studio menu) and then check the “Thrown” checkbox in that dialog for the exception(s) you are interested in. Once the “Thrown” checkbox is checked, the Visual Studio debugger will now stop at the point an exception is thrown, even if later the exception is caught somewhere else. And so now you can find that hidden SqlException. This feature has been in the Visual Studio debugger since 2003.

More details on this feature on MSDN.
And lastly, all of the code in the videos you see above is part of the TRINUG Web App that was built during the 2014 series of Hands On labs about MVC. So, many thanks to the numerous people who worked on those presentations and the code for the app. You can find the code and labs on GitHub.